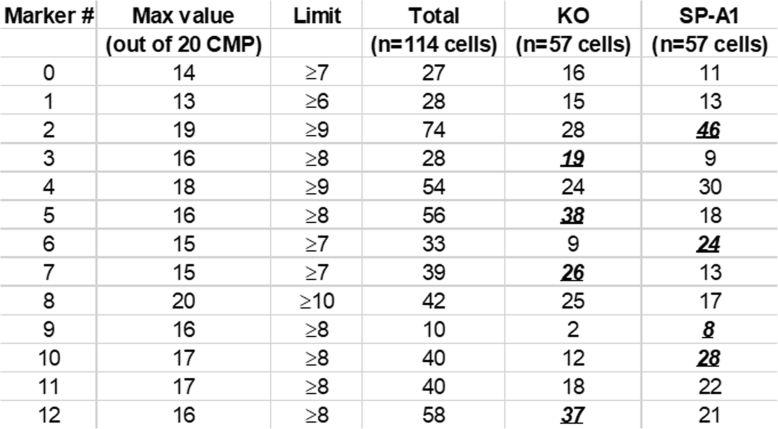
- Marker # and name are listed in the two columns on the left (additional name details are in Table 2. For each marker (left hand column) the maximum number of CMPs out of the 20 most abundant CMPs (Max value) present in at least one cell is shown. For example, a value of 14 for marker 0 means that in at least one cell of the total 114 cells there were 14 CMPs among the 20 most abundant CMPs containing marker 0, and that none of the 114 cells analyzed contained more than 14 CMPs with marker 0. For marker 8, on the other hand, there was at least one cell out of the 114 analyzed that contained marker 8 in all 20 top CMPs, hence Max value for marker 8 is 20 (the highest that it can be). Next, a “limit” or threshold was set of about one half of that maximum and then we selected the cells out of the 114 cells that expressed the highest numbers (at or above the limit) of CMPs containing each marker. The resulting cells were then categorized as being either in the KO or SP-A1 experimental groups. In the case of marker 0, a total of 27 cells (out of 114) were at or above the limit of 7. Of the 27 cells, 16 were among the 57 analyzed cells in the KO group and 11 were in the SP-A1 group. Markers that were heavily represented in one group and of potential use as a selection tool are in bold, italicized, underlined type
